Oh Deer Apes Activity
Oh Deer Student Response Sheet
1. Name three essential components of habitat (things animals need to survive).
A.food
B.water
C.Shelter
2. Explain what caused the increase of “deer” during the activity you participated in.
What caused an increase of deer were more resources.
3. Explain what caused the decrease of “deer” during the activity you participated in.
The decrease of deer were from a lack of resources and disasters like a drought.
4. Define the term limiting factor. Give examples of limiting factors for the deer in our activity.
A limiting factor is a factor that limits the population. The limiting factor in this activity were resources.
5. Graph the data from the activity and attach to this sheet (make sure to correctly title and label
the axes). Describe what the graph of our data looks like. How and why did our deer
population change?
The graph looks like it went up and down for every other turn. The deer population changed due to the amount of resources.
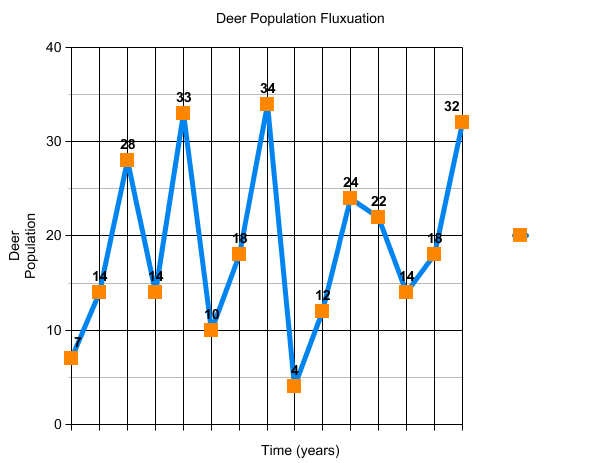
6. Often we use the phrase “balance of nature” to describe a healthy ecosystem. Based on our
graph, what does the “balance of nature” look like? Should we expect populations to be static
(unchanging) or do they naturally fluctuate? Explain.
Populations naturally fluctuate as resources aren't infinite. Due to this, populations will decrease and increase when resources will be available. The balance of nature was the graph becoming jagged.
7. What did you learn about population dynamics by doing this activity?
I learned that population is based off the balance of resources and how much population is consuming it.
